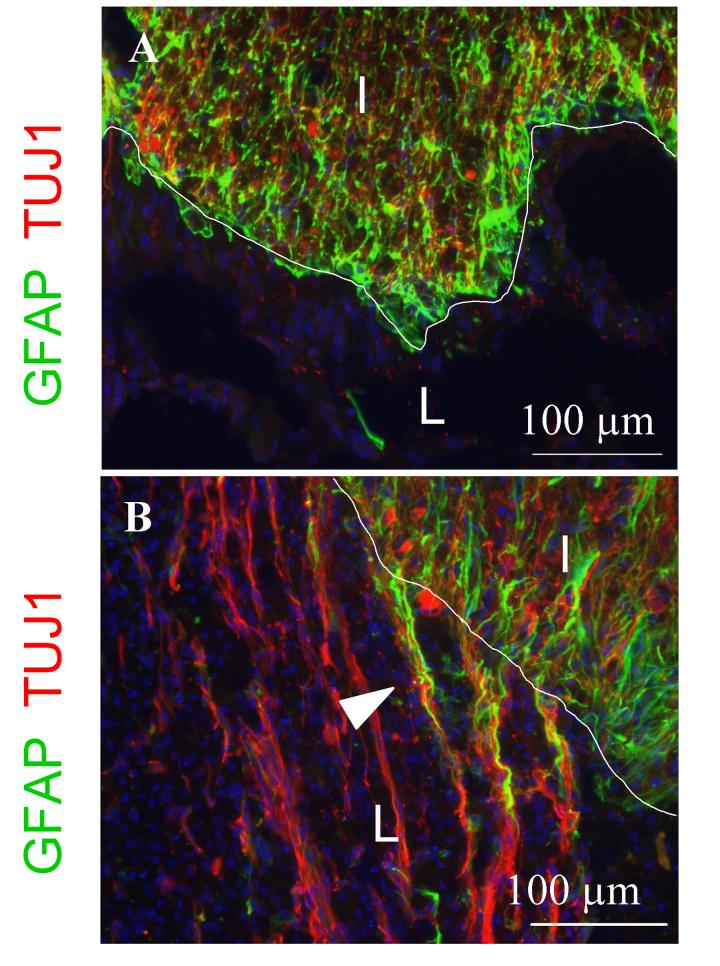
Figure 4.
Infiltration of (A) TBS and (B) F-DS-NT3(1000 ng/mL) treated cords by neurons and astrocytes. In all panels, blue is Hoechst nuclear stain. Horizontal sections. A, B. Neuronal fiber (Tuj1, red) and astrocyte (GFAP, green) double staining at rostral border of gray matter with the lesion. I, intact cord; L, lesion; border indicated by white line. Arrowhead indicates neuronal fiber sprouting into lesion along elongated astrocytes processes.

