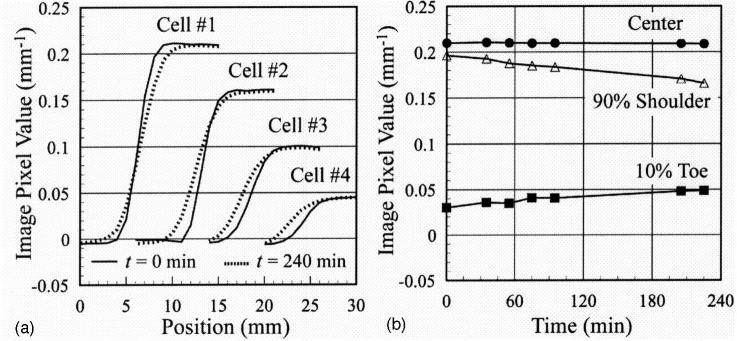
FIG. 10.
Variation in optical-CT profiles through the fingers in Fig. 8(a)over a 4 h period.(a)Cross-plane profiles through the four fingers for scans acquired at time zero(solid curves) and t=4 h (dotted curves). (b)Plots of the image pixel value in the central, shoulder, and toe regions of Cell #1 versus time.

