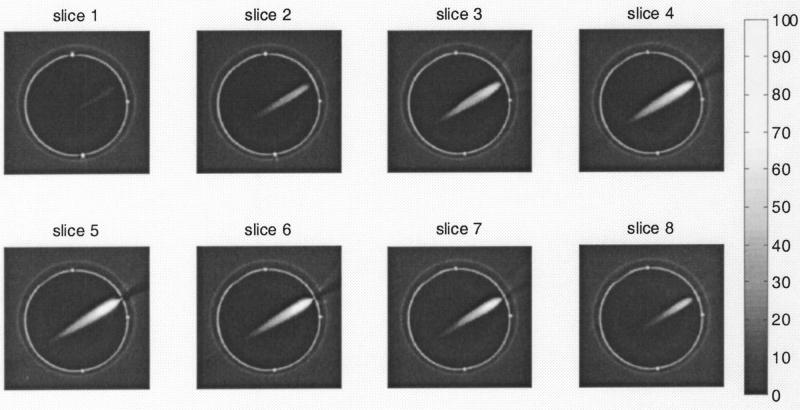
FIG. 11.
Optical-CT images of the relative dose distribution delivered in a PAG after irradiation by focused photons (40-80 KeV)emitted by the x-ray lens (shown in Fig. 4). The cylindrical gel flask is ∼8 cm in diameter and the slices are 1 mm apart. The in-plane resolution is 1×1 mm2. The comprehensive 3D measurement presented here would be very difficult to achieve with conventional dosimeters because of the low energy of the radiation and the small dimensions of the field.

