
FIG. 14.
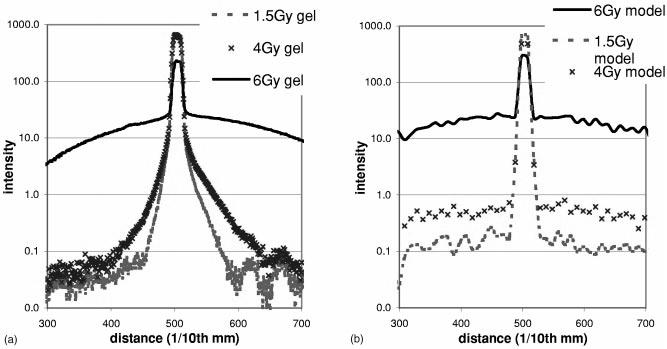
Measured(a) and Monte Carlo calculated (b)profiles across the laser beam on the exit of PAG gels irradiated to different dose levels [measurement setup shown in Fig. 5(b). The Monte Carlo model is observed to reproduce the general behavior of the measured profiles but the limitations of the Mie model are observed in the failure to accurately model the penumbral tails of the PAG gels receiving a low and medium dose.(Note: discrepancies are highlighted by the log scale.