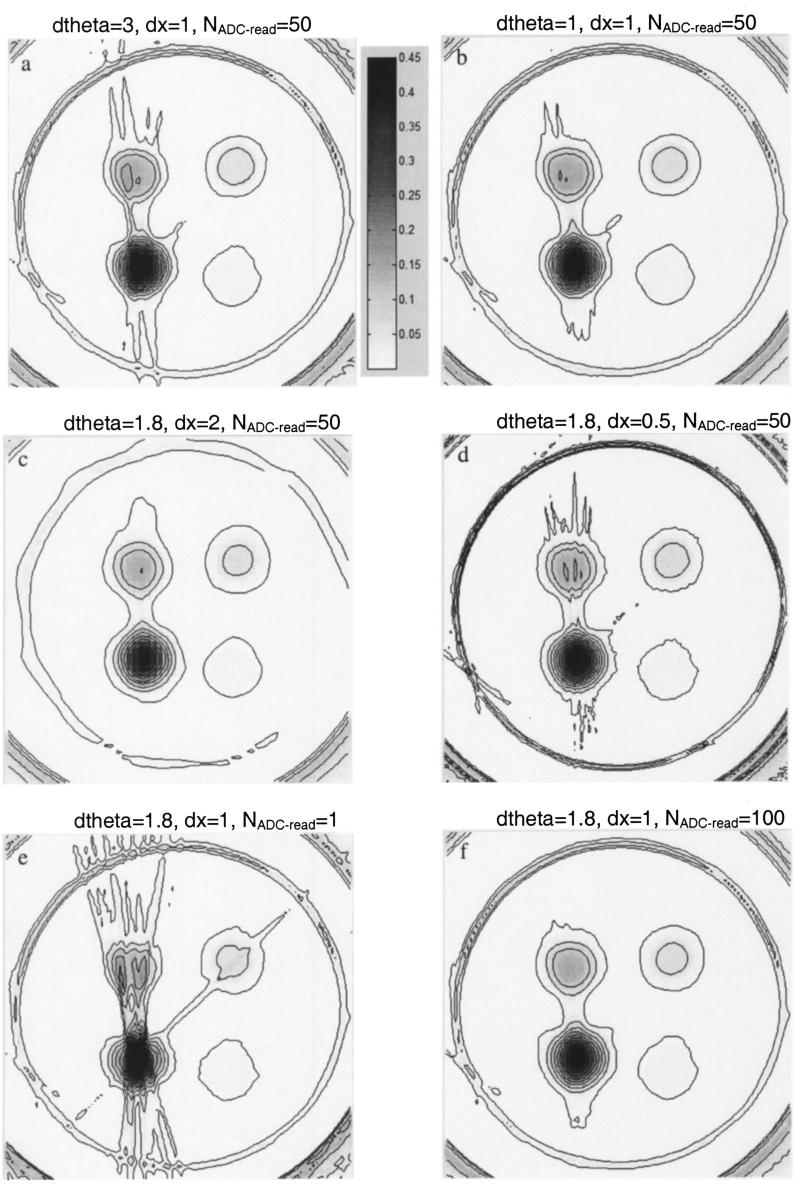
FIG. 6.
Sample optical-CT images of the same finger phantom, illustrating the effect of varying key acquisition parameters on image quality: ADC averaging (NADC read), rotational increment between projections (dtheta=360/Nprojections), and linear step size between line integrals (dx). Figures are presented in pairs corresponding to the lowest and highest quality images for a particular acquisition parameter (further details given in the main text). Units are attenuation coefficient (mm-1) relative to the optically matched bath.

