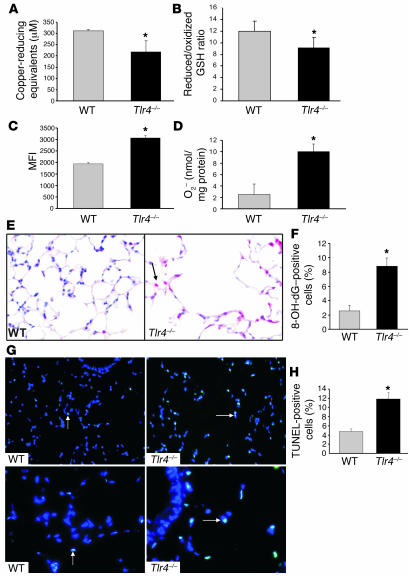
Figure 3. Decreased antioxidant capacity and increased oxidant burden in Tlr4–/– mice.
(A) Total antioxidant activity was measured in the BAL of 3-month-old WT and Tlr4–/– mice (n = 5–6). (B) The ratio of reduced GSH to oxidized GSH was detected in BAL of 3-month-old WT and Tlr4–/– mice (n = 6). (C) Quantitation of flow cytometric results from dihydroethidine staining in total lung cells isolated from 3-month-old WT and Tlr4–/– mice (n = 3). MFI, mean fluorescence intensity. (D) Detection of O2– production by cytochrome C reduction assays in total lung cells isolated from 3-month-old WT and Tlr4–/– mice (n = 3). (E) Representative DNA oxidation detection by 8-OH-dG immunohistochemical staining in the lungs of 3-month-old WT and Tlr4–/– mice. Arrow indicates positive red staining for 8-OH-dG. Original magnification, ×400. (F) Graphical quantitation of 8-OH-dG–positive cells expressed as % of total cells in lung sections (n = 3). (G) Representative merged images of lung sections stained with TUNEL (green) and DAPI stain (blue) from 3-month-old WT and Tlr4–/– mice. Arrows indicate representative TUNEL-positive cells (blue-green). Original magnification, ×200 (top panels); ×400 (bottom panels). (H) Graphical quantitation of TUNEL-positive cells expressed as percent of total cells in lung sections (n = 3). Data are mean ± SEM. *P < 0.05 versus WT.

