Figure 2.
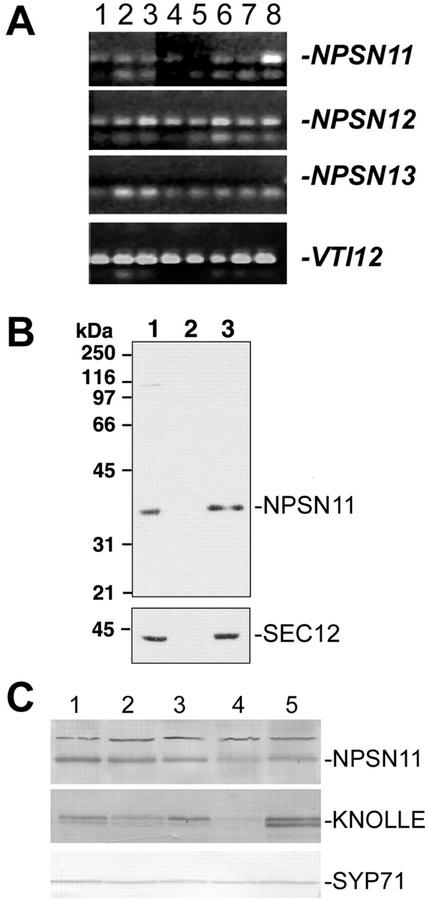
NPSN11 and -12 have different tissue distribution patterns. A, RT-PCR was performed with primers specific for NPSN11, NPSN12, NPSN13, and VTI12, using total RNA prepared from the roots of a 3-week-old liquid-cultured plants (lane 1), the leaves of the same liquid-cultured plants (lane 2), flowers from mature soil-grown plants (lane 3), expanding rosette leaves (lane 4), mature rosette leaves (lane 5), green siliques (lane 6), the lower 3 cm of stem (lane 7), and the top 3 cm of the stem (lane 8). Amplified products were separated on agarose gels and visualized with ethidium bromide. Bands specific to each gene are indicated with a dash. No product could be observed with the NPSN13-specific primers. B, Extracts of Arabidopsis suspension-cultured cells were fractionated by differential centrifugation at 150,000g. Twenty micrograms of the resulting fractions of total protein (lane 1), supernatant (lane 2), and microsomal fractions (lane 3) were separated by SDS-PAGE and immunoblotted with affinity-purified NPSN11 antibodies (see “Materials and Methods”) or with the microsomal marker SEC12 (Bar-Peled and Raikhel, 1997). C, NPSN11 protein distribution. Equal amounts of total protein extracted from stems (lane 1), siliques (lane 2), roots (lane 3), leaves (lane 4), and flowers (lane 5) were separated by SDS-PAGE and blotted with antisera to NPSN11, KNOLLE, or SYP71. Bands specific for each protein are indicated with a dash.

