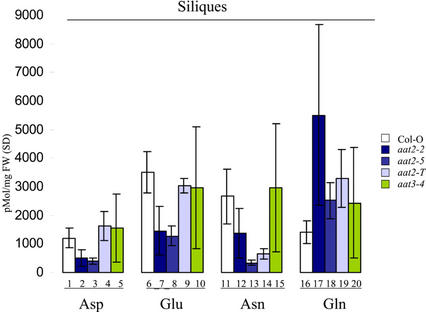
Figure 6.
HPLC analysis of Asp, Asn, Glu, and Gln in the siliques of aat mutants. The levels of free amino acids in cytosolic aat2 (blue bars) and chloroplastic aat3 (green bars) and wild-type plants (white bars) were analyzed in siliques using HPLC (n = 3). Each individual represents a biological replicate. All errors in the HPLC analyses represent biological replicates.

