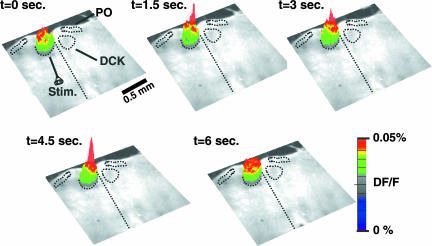
Fig. 3.
Voltage-sensitive dye imaging showed ensemble activation of the DCK nucleus. Shown is a sequence of three-dimensional images of the spatiotemporal in fluorescence of a transverse slice stained with the voltage-sensitive dye di-4ANEPPS. The images are superimposed on a contrast photo of the slice. A bipolar electrode delivered a pair of stimuli (two shocks at 200-μs width delivered at 50 Hz) at the edge of the DCK (t = 0). Each image represents an average of four consecutive frames taken at a 100-Hz sampling frequency. The baseline activity is represented by the images at t = 0 and 6.0 s. The images at t = 1.5, 3.0, and 4.5 s show ensemble activation of the DCK nucleus. The locations of the DCK and PO nuclei are also indicated schematically by black dotted lines.

