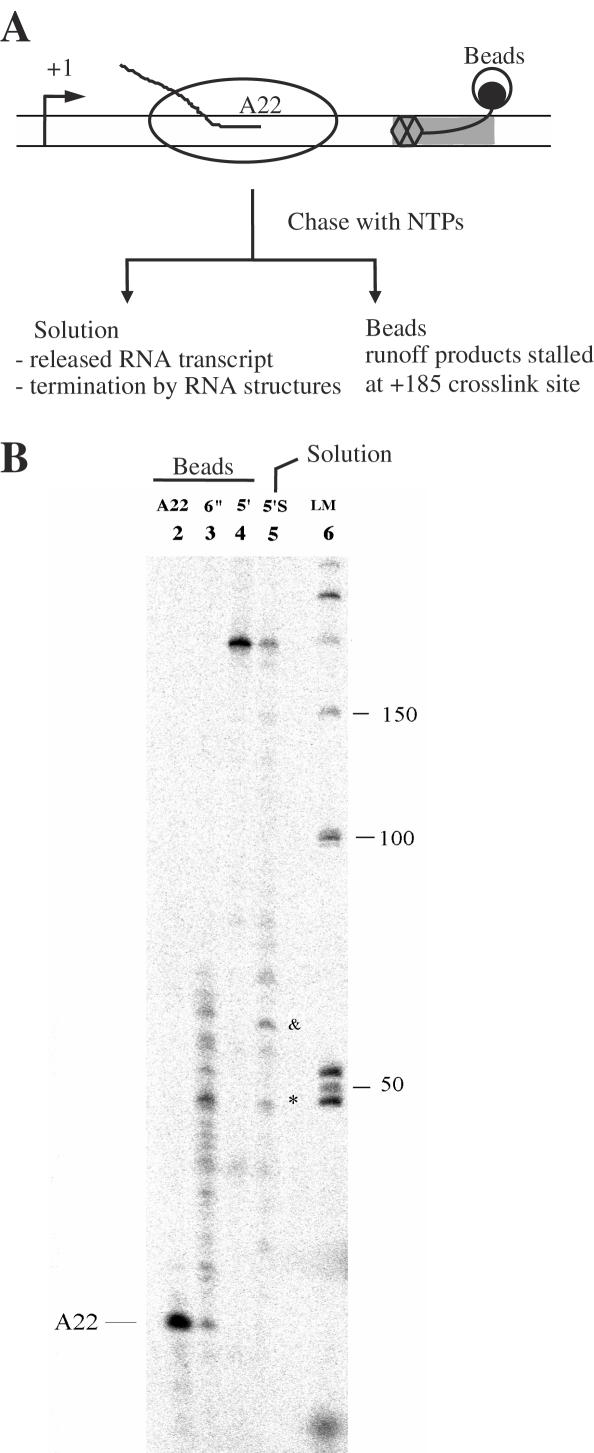
Figure 5.
TAR31 acts as a transcription elongation termination signal. (A) Experimental outline for analyzing transcription elongation termination. A homogeneous population of TECs were stalled at A22 position and chased with unlabeled NTPs. Beads and solution phases were separated and analyzed on denaturing gels as described previously (21). Transcription reactions were monitored at 6 s and 5 min time periods. (B) Analysis of transcription products. Lane 2 shows transcripts from TECs stalled at position A22. Lanes 3 and 4 are transcripts from TECs chased with NTPs for 6 s and 5 min, respectively. Lane 5 contains transcripts released from TECs into solution during the 5 min chase with NTPs. Lane 6 is a marker lane. Two major termination signals were observed around 46 nt (*) and 60 nt (&). Quantitative analysis of band intensities in lane 5 shows that ∼21.8% TECs produced the runoff products and the amount of terminated transcripts containing 46 and 60 nt were 13.4 and 18.6%, respectively.

