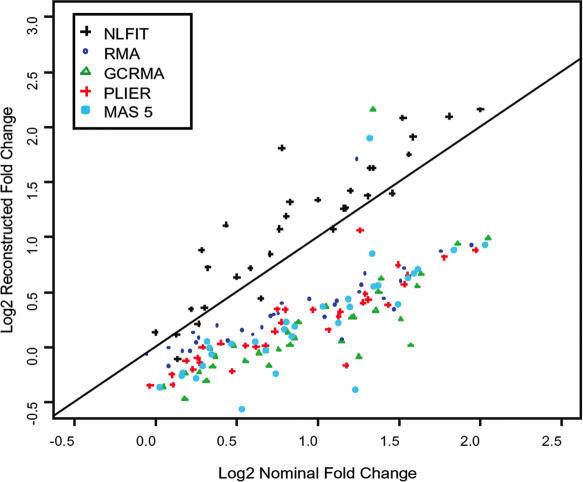
Figure 7.
Reconstructed log2 fold-change versus nominal log2 fold changes of wholly defined control spike-in dataset for MAS 5.0 (light blue closed circle), PLIER (red +), GCRMA (green open triangle), RMA (blue open circle) and NLFIT (black +). Median fold changes for each method are shown. The x = y line is shown in solid black.

