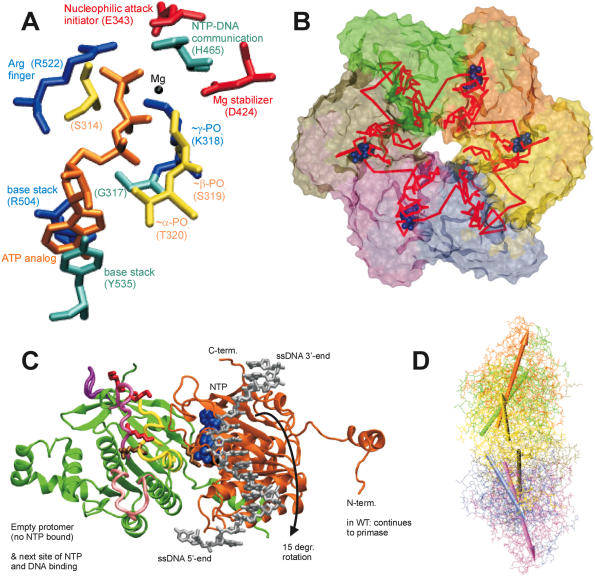
Figure 1.
(A) Critical residues coordinating the bound nucleotide. Amino acids around the nucleotide binding site of T7 helicase are shown with brief notes on their possible functions. The nucleotide is in orange, Mg(II) in black, Arg and Lys in blue, Asp and Glu in red, Ser and Thr in yellow, His, Tyr and Gly in cyan. Among the included residues, 314, 317, 318, 319 and 320 are a part of the Walker A loop, whereas residue 424 is a part of the Walker B motif. All the residues are from the B chain in the strucutre 1e0j (17), except R522 which is from the C chain. (B) Conformational change transmission network in the structural model of the ring-shaped hexameric T7 helicase. All six subunits of the T7 helicase domain are illustrated by a surface representation and the red lines show one of the possible conformational change transmission paths with an undefined (and un-implied) directionality and sequence. The red network simply traces the inter-subunit sensor R522, the hypothetical DNA binding loops (424–439, 464–475, 503–513), the residue that is likely to establish intra-domain nucleotide ligation state communication (H465), a residue proposed to initiate the nucleophilic attack (E343), residues that disrupt helicase functioning when mutated (S345, E348, S496, R487, G488, S345, G451) (27) and eight other amino acids that are critical in coordinating or stabilizing the bound cofactor (S314, G317, K318, S319, T320, D424, R504, Y535) (17). The order of residues is as follows: 522, 451, 496, 488, 487, (475–464), (439–424), (503–413), 314, (317–320), 343, 345, 348, 535, next522. Coloring of the subunits A–F is as follows: yellow, orange, green, tan, mauve, iceblue. (C) Two helicase protomers with a possible delineation of single stranded DNA. Two subunits of the hexameric helicase are viewed from the central channel, their C-termini facing upward. The DNA is oriented with its 5′ end facing down in the figure. DNA is initially bound to the right subunit, which is bound to NTP and thus is in a high affinity state for DNA. The difference in orientations between unbound and NTP docked conformations is a rotation of 15°, which might correspond to the power stroke (17). The directionality of the rotation upon NTP docking (shown with an arrow) agrees with the proposed orientation of DNA. The probability of DNA being caught by the left subunit that supplies the Arginine finger is increased both because of its likelihood of binding to NTP in the next step and because of its vicinity to the center of the ring [5 å closer than the other neighbor (17)]. We took the single DNA strand from NDB code bd0070 and manually positioned it on a dimer from PDB code 1e0j (17). We used VMD and its associated routines (62,63) for visualization and POV-Ray (http://www.povray.org/) for rendering. The ligand-free subunit is in green (chain C in the structure), the NTP bound one is in orange (chain B). The DNA is shown in silver and the nucleotide in blue. The putative DNA binding loops [424–439 in pink (lowermost), 464–475 in mauve (middle), 503–513 in purple (uppermost loop)] (17), the motif H4 (480–500 in yellow) and the mutationally tested residues on them are also indicated (K467, K471, K473 in red R487, R522 in tan) on the C subunit (green subunit). (D) Relative orientations of helicase monomers. To get an idea for the inherent symmetry in a hexameric ring, we can look at the orientations of the six monomers with respect to a common reference, such as the line passing through the central channel through bound DNA. If for all subunits, a chosen line within the monomer that connects one of its residues close to the inner channel to another one distal to the inner channel, is equally perpendicular to the line of DNA, then we would conclude that the monomers are symmetrically arranged with respect to the above chosen definition. When we apply this type of an analysis to T7 hexamer (17), we see that the monomers are not arranged symmetrically (17). For instance the upper part of the figure has A, B and C subunits in yellow, orange and green. A is closest to the screen and C is the distal one. As seen, there is an apparent rotation (∼15°) between successive units (17). To relate to the mechanism shown in (C) [the DNA in (D) has its 5′ end towards the right side of the figure], we can use two simple approaches: As the DNA is initially bound to subunit B, upon NTP hydrolysis the orientation of subunit B would become similar to that of subunit A (because the electron density in the crystal structure was lesser for subunit A nucleotide than for subunit B nucleotide, thus A is more like an NDP state whereas B is more like an NTP state) (17), as a result the B subunit rotation would be in a direction to extrude DNA towards the 5′end (right side). As a second approach to interpret the figure, we can consider the biochemical finding that the NTP docking is the power stroke step (32): in this case after an empty subunit (such as C) receives DNA, it would move it as soon as the nucleotide docks and as the subunit C is already in the maximally rotated state, the only way it can rotate will be in the direction to reset its orientation to that of monomer B (since C is binding NTP as it is doing this, it is already natural for it to assume the state of the NTP bound monomer). In both cases the direction of extruding DNA is toward the right, ie. the 5′ end of DNA, thus making the helicase movement 5′–3′. The relative arrangement of the upper trimer and the lower trimer is not significant, as the lower one was just modeled upon the upper one via symmetry assumptions. The coloring is the same as in (B), arrows having the same colors as the monomers that they represent.

