Figure 1.
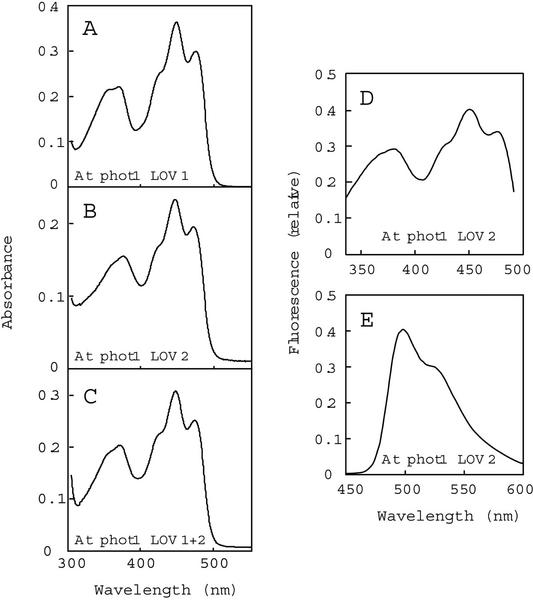
Absorption and fluorescence spectra of the Arabidopsis phot1 LOV domains purified from E. coli extracts. A through C, Absorption spectra of LOV1 (A), LOV2 (B), and LOV1+2 (C). The concentrations of FMN bound for each fusion protein were 28, 16, and 25 μm, respectively. D, Fluorescence excitation spectrum for Arabidopsis phot1 LOV2. Fluorescence emission was monitored at 520 nm. E, Fluorescence emission spectrum for Arabidopsis phot1 LOV2. Excitation was at 390 nm. At, Arabidopsis.

