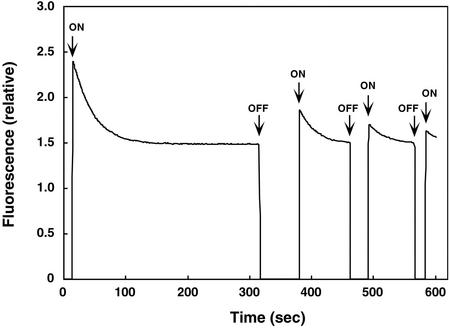
Figure 3.
Time course for fluorescence changes for the Arabidopsis phot2 LOV1 domain. Excitation was at 450 nm and emission was monitored at 490 nm. Before the start of the experiment, the sample was incubated in darkness for 10 min. The time scan was started at 0 s in the dark, and the shutter for the excitation beam was opened at 13 s (first ON). The decay curve for fluorescence emission was used to calculate photoproduct formation. When the fluorescence reached steady state (316 s), the shutter was closed (first OFF). After an additional predetermined time in darkness (74 s), the shutter was reopened. The magnitude of the immediate fluorescence increase reflects the amount of recovery of the initial fluorescent state. As soon as the signal reached steady state again (462 s), the shutter was closed. It was then re-opened to make a lights-on measurement after another predetermined period of time (in this case 29 s), etc. In this way, a time course for the regeneration of a fluorescent species could be followed.

