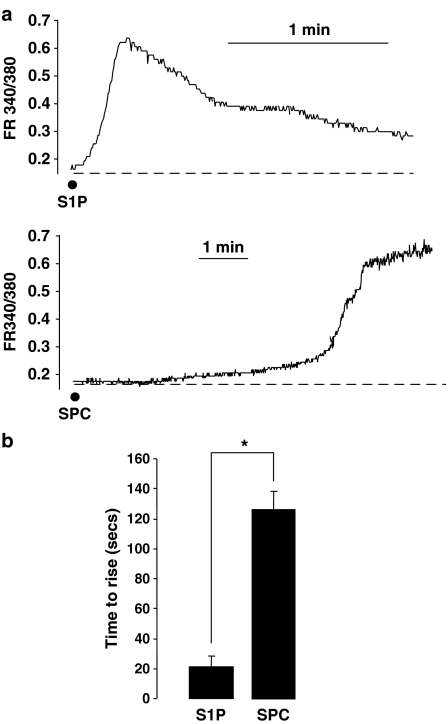
Figure 2.
Sphingolipid-induced increases in [Ca2+]i from cerebral artery myocytes. (a) Representative Fura-2 fluorescence ratio traces (FR340/380) showing the changes in fluorescence produced upon application of S1P (5 μM, n=12) and SPC (10 μM, n=41) in freshly isolated myocytes from rat cerebral artery. (b) Bar graph showing the time taken for the fluorescence ratio to rise to peak after addition of S1P (5 μM, n=12) and SPC (10 μM, n=41). Data are mean±s.e.m. Asterisk denotes P<0.05.

