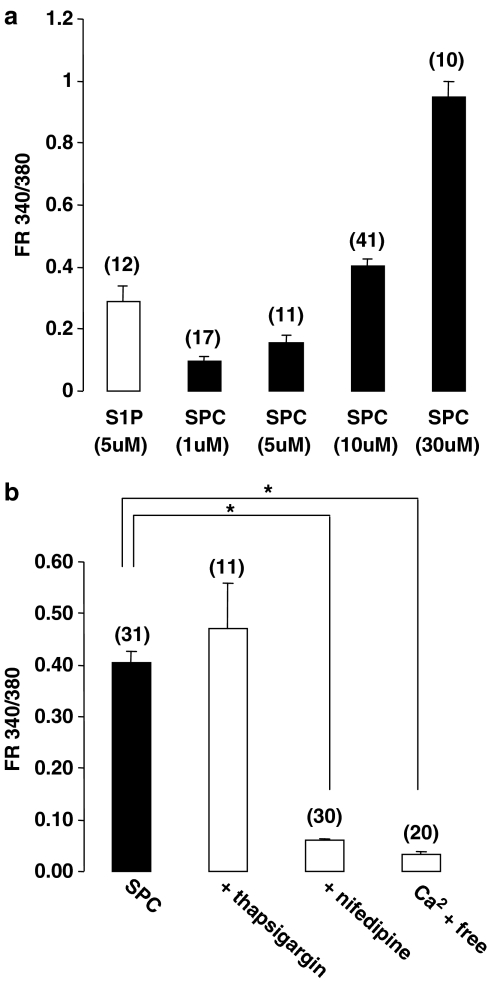
Figure 3.
Characteristics of the SPC-induced [Ca2+]i increase in rat cerebral artery myocytes. (a) Mean data showing the increase in fluorescence ratio (peak) relative to resting levels induced by increasing concentrations of SPC. EC50 could not be calculated as the curve was not saturable at soluble concentrations of SPC. (b) Mean data showing the increase in fluorescence ratio (relative to resting levels) induced by SPC (10 μM) following pretreatment with either 1 μM thapsigargin, 2 μM nifedipine or in the presence of no added extracellular Ca2+. Thapsigargin had no effect on SPC-induced [Ca2+]i. However, both nifedipine and the removal of extracellular Ca2+ significantly decreased the Ca2+ increase induced by SPC. Resting Ca2+ levels at 10 μM SPC are 0.30±0.01 FR340/380 (n=83). Data are mean±s.e.m. with numbers of cells in parentheses. Asterisk denotes P<0.05.

