Figure 5.
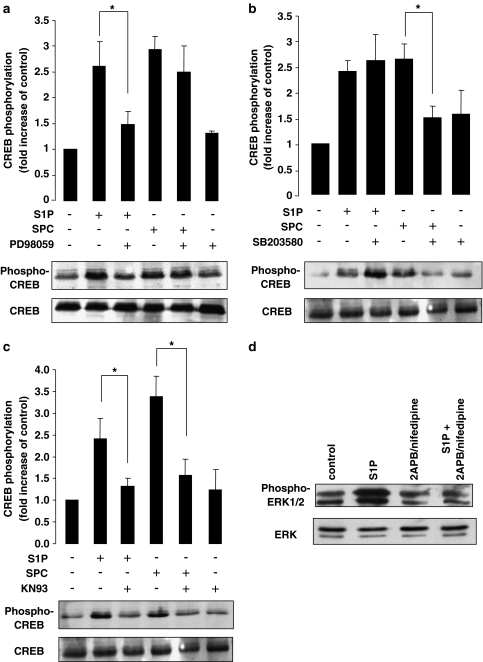
Intracellular mechanism of CREB phosphorylation by S1P and SPC. (a) Representative immunoblot and bar graph showing the fold increases in CREB phosphorylation by S1P and SPC in the rat cerebral artery in the presence of the ERK1/2 inhibitor, PD98059 (30 μM). The S1P-induced phosphorylation was significantly inhibited in the presence of PD98059 while the SPC-induced phosphorylation was unaffected (n=4). (b) Representative immunoblot and bar graph showing the fold increases in CREB phosphorylation by S1P and SPC in the presence of the p38MAPK inhibitor, SB203580 (30μM). The SPC-induced phosphorylation was significantly inhibited in the presence of SB203580 while the S1P-induced phosphorylation was unaffected (n=6). (c) Representative immunoblot and bar graph showing the fold increases in CREB phosphorylation by S1P and SPC in the presence of the CaM kinase inhibitor, KN93 (30 μM). Both the S1P- and SPC-induced CREB phosphorylation was significantly inhibited by KN93 (n=4). (d) Typical immunoblot showing S1P-induced ERK1/2 activation following pretreatment with 2-APB and nifedipine. ERK1/2 phosphorylation was significantly decreased in the presence of inhibitors (S1P stimulation 5.6±0.5-fold increase of control; S1P stimulation following 2-APB/nifedipine pretreatment – 0.7±0.1-fold increase of control, n=3, P<0.05). Data shown are mean±s.e.m. Asterisk denotes P<0.05.

