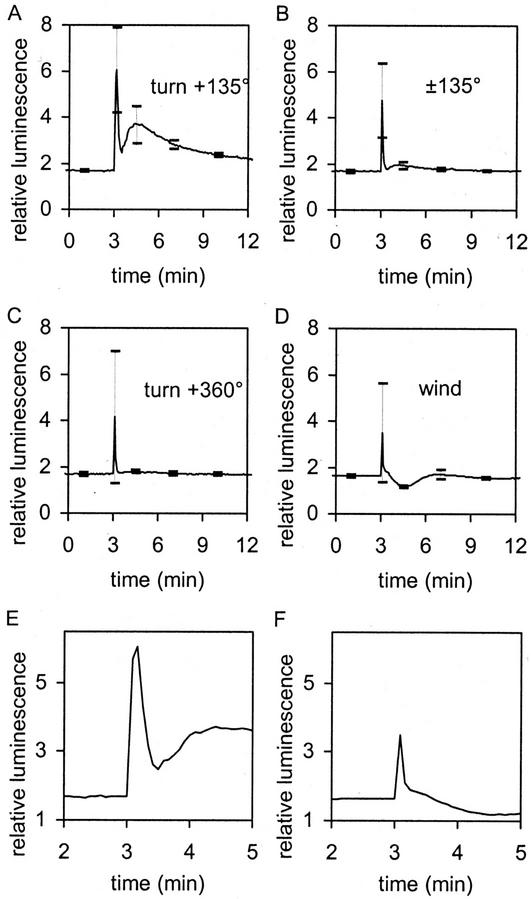
Figure 3.
Effect of different stimuli on the [Ca2+]c response. A, Gravistimulation: at t = 3 min, the plate with seedlings was turned through 135°. B, Control: At t = 3 min, the plate was turned 135° and immediately (within the same sample interval) back to vertical position. C, Control: at t = 3 min, the plate was turned 360°. D, Control: stimulation by wind; at t = 3 min, 50 mL of ambient air was blown in 1 s through the plate. sds are given at t = 1.0, 3.1, 4.5, 7.0, and 10 min with n = 5 for all curves. E and F, Enlargements of A and D, respectively, to show main initial [Ca2+]c spike after stimulation and reveal the difference in time scale.

