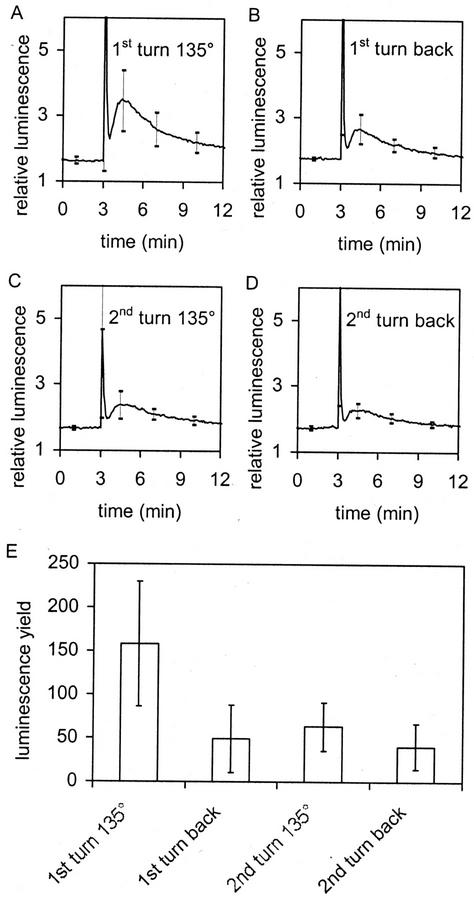
Figure 4.
Attenuation of the gravity-induced slow [Ca2+]c phase, i.e. desensitization, as measured by decreasing amplitudes with repeated gravistimulation. Curves in A through D are averages of five. sds are given at t = 1.0, 3.1, 4.5, 7.0, and 10 min. E, Light yields produced by stimulation (i.e. integrated areas under the curves shown in A through D minus background).

