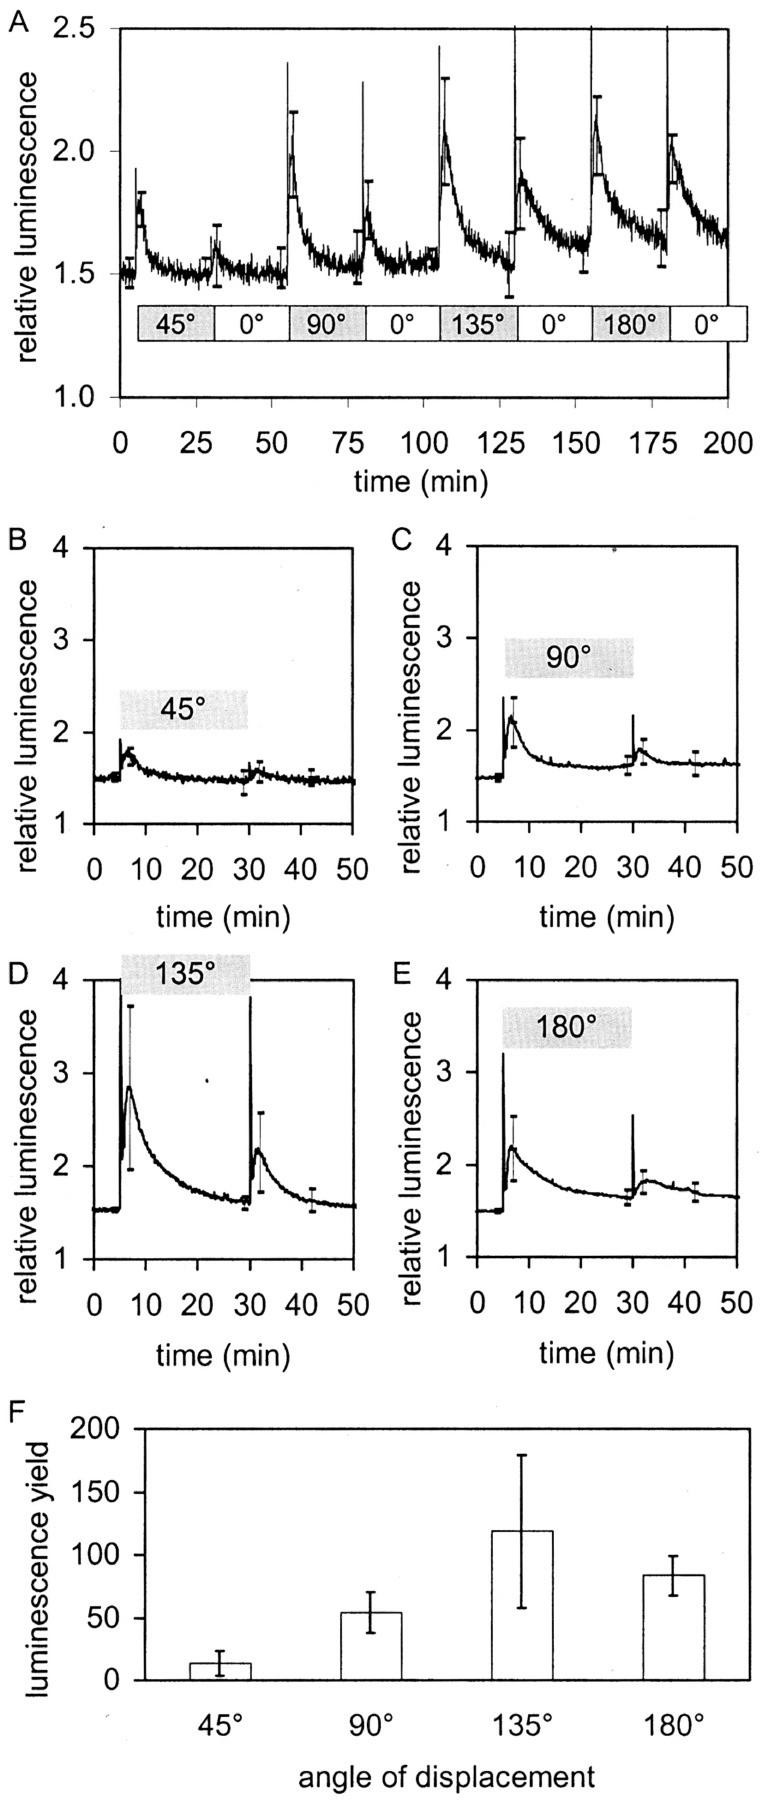
Figure 5.
Effect of different angles of displacement on the [Ca2+]c response in Arabidopsis. A, The plate with seedlings was tilted as indicated by the bar. Trace is average of four. sds are given at 3, 7, 28, 32, 53, 57, 78, 82, 103, 107, 128, 132, 153, 157, 178, and 182 min. B through E, Independent averaged experiments: The plate was tilted at t = 5 min by the angle indicated in the figures and turned back to vertical at t = 30 min. All traces are averages of five. sds are given at t = 4, 7, 29, 32, and 42 min. F, Light yields produced by stimulation with different angles of displacement (i.e. integrated areas from t = 5–30 min under the curves shown in B–E minus background).

