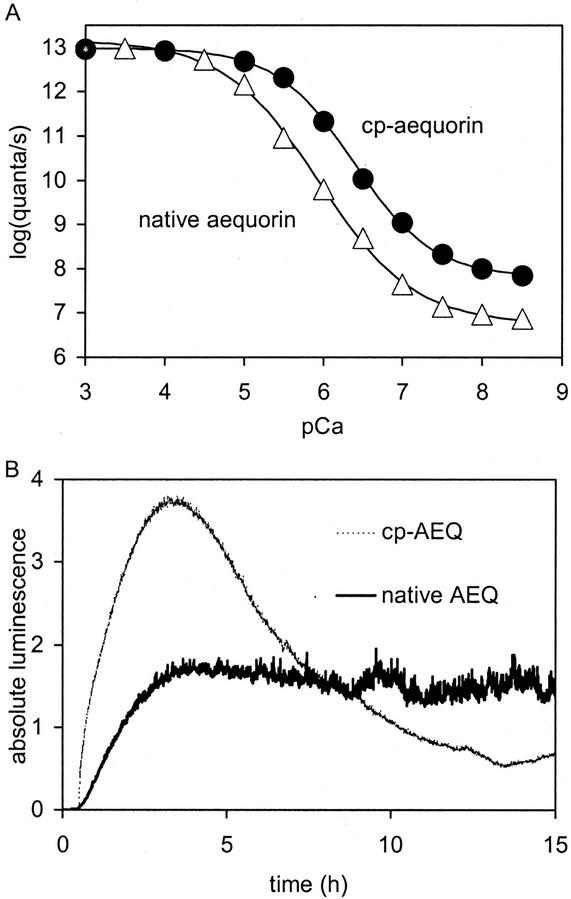
Figure 9.
Differences between native aequorin and cp-aequorin. A, Relationship between [Ca2+] and luminescence (data taken from Shimomura et al., 1993, and fitted with sigmoidal Bolzmann fit). B, In vivo reconstitution of aequorin in the cytoplasm of Arabidopsis roots with native CTZ (dark line) and cp-CTZ (light line). Addition of CTZ at t = 0.5 h. Absolute luminescence (×10,000) is given in B, which is luminescence of each integration interval divided by total luminescence produced by the specimen. Relative luminescence (×10,000) is given in all other figures, which is luminescence of each integration interval divided by luminescence still remaining in the specimen. The characteristics of the fitted curves in A are: ▵, native aequorin, 50% midpoint of 5.9 pCa, background of 6.8 log quanta s−1; and ●, cp-aequorin, 50% midpoint of 6.4 pCa, background of 7.8 log quanta s−1.

