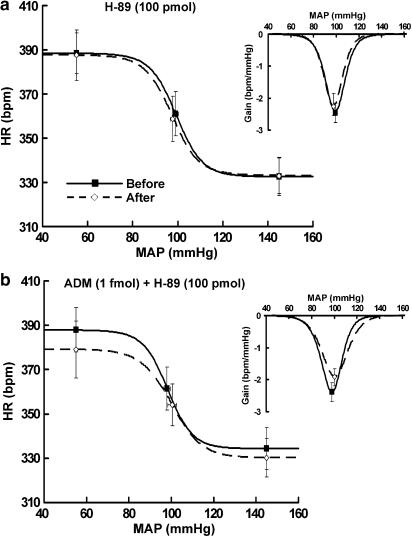
Figure 5.
Average baroreflex curves generated before and during the first hour after100 pmol H-89 (a, n=4) or 1 fmol ADM plus 100 pmol H-89 (b, n=4) was microinjected into the RVLM. Insets, average gains of baroreflex control of HR as a function of MAP. Symbols represent the upper plateau, set-point, and lower plateau of baroreflex curves, respectively.

