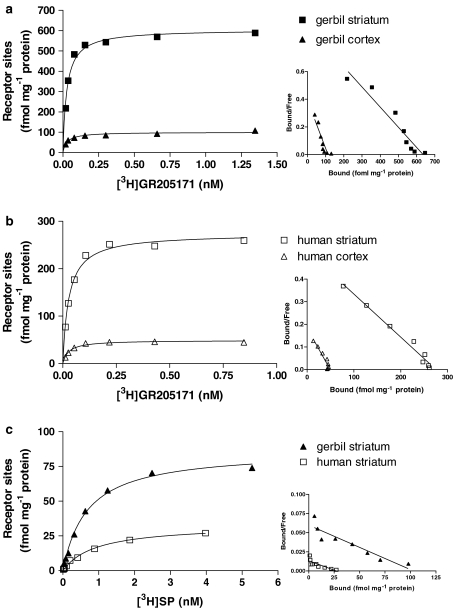
Figure 2.
Representative saturation binding experiments with the NK1 receptor antagonist [3H]GR205171 in gerbil (a) and human (b) striatum and cortex and with the endogenous agonist [3H]SP (c) in gerbil and human striatum. Relative Scatchard plot is shown on the right of each saturation curve. Brain samples of subject A were used in these experiments. See Methods for experimental procedures.

