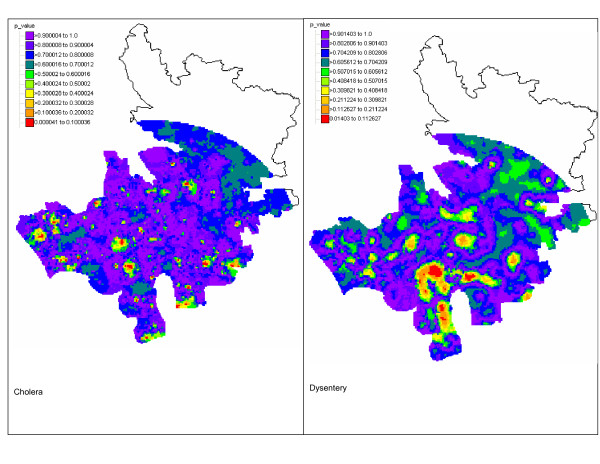
Figure 6.
Maps of the p-values for the test of uniformity of local incidence rates for cholera and dysentery in Matlab 1994. At each location, the population-weighted mean of all bari rates is compared to the probability distribution of the local incidence rate which is fully characterized by the Poisson kriging estimate and variance. The lower the p-value, the more likely the local rate is significantly smaller or higher than the regional rate.

