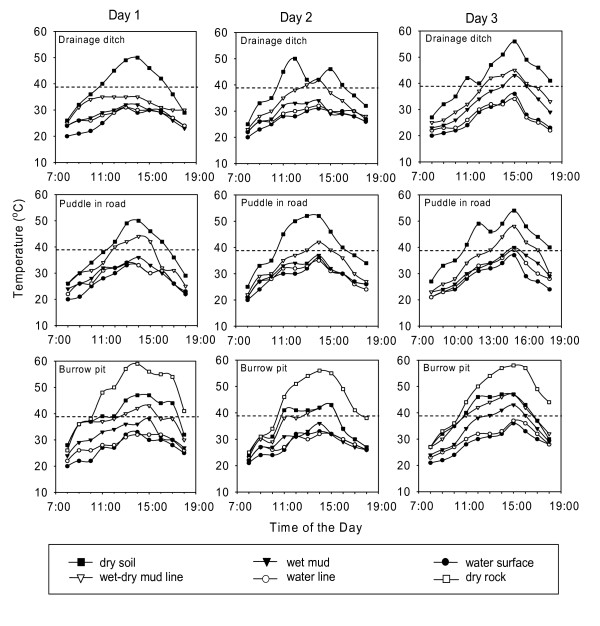
Figure 5.
Daily temperature profiles in and around three typical types of Anopheles gambiae larval habitats on three consecutive days (May 10, 11, and 12, 2005). The dotted line represents the upper tolerable temperature (40°C). Profiles recorded at similar sites on 4 other days were very similar. Table 1 reports outcomes across all the data.

