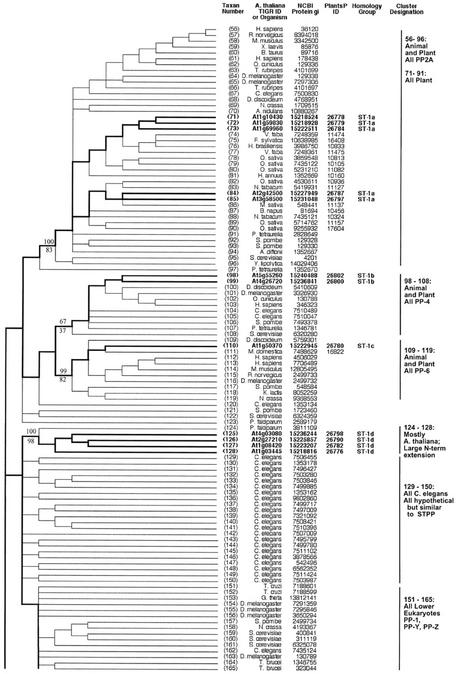
Figure 2.
Topographic cladogram with additional information for ST protein phosphatase sequences 56 through 165. Branch lengths for the cladogram are unit length. Representative bootstrap values are shown; the value above the line is the ClustalW NJ value, and the value below the line is the maximum parsimony value (see “Materials and Methods”). Taxon number is as shown in Figure 1, and an appropriate NCBI gi number is provided for each taxon. Information for Arabidopsis sequences is in bold and branches leading to these taxa are broad. The PlantsP plant phosphorylation database (Gribskov et al., 2001) identification number is shown for all plant sequences. The cluster designations shown correspond to those shown in Figure 1. The Institute for Genomic Research ID numbers are shown for the Arabidopsis taxa. For all other taxa, the organism encoding the protein is shown. Standard nomenclature as taken from the NCBI taxonomy database (Wheeler et al., 2000) is used for all free-living organism names; virus abbreviations are shown in “Materials and Methods.” Homology group, based on protein and DNA sequence alignments, is as defined in “Materials and Methods.” The following sequences were rejected at the final alignment stage: At3g19980, At1g48120, At1g20320, and At5g10900.

