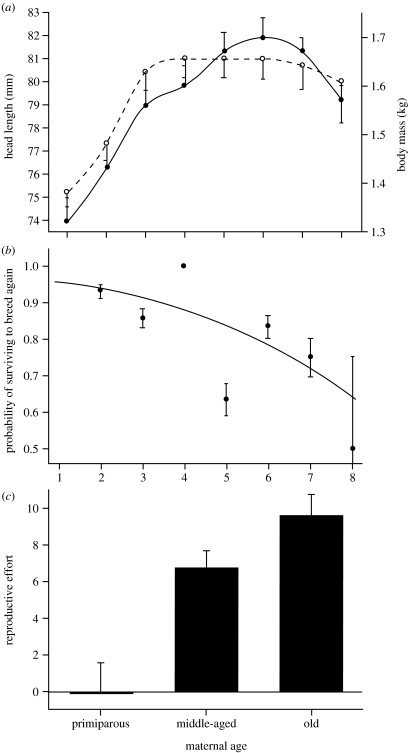
Figure 1.
(a) Age-specific changes in mean head length (mm; −s.e.; open circles) and mean body mass (kg; +s.e.; filled circles) in female possums. (b) Age-specific probability of surviving to breed in the next year. The line is that predicted by a nominal logistic regression, filled circles show the actual proportion of females surviving at each age class (±s.e.). (c) Mean reproductive effort (relative mass loss in lactation) in relation to age class, ±s.e., sample sizes shown above columns.

