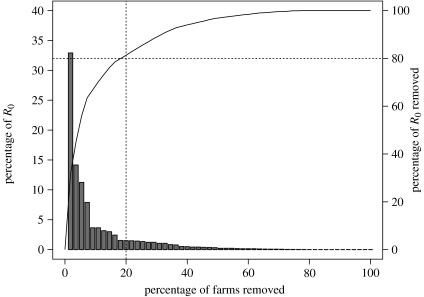
Figure 2.
Contributions of individual holdings to R0. Histogram shows the distribution of the product β1β2 for individual holdings, arranged in descending order (left vertical axis). Solid line shows the relationship between the percentage of holdings removed from the sample dataset and the cumulative percentage reduction of R0 as a consequence (right vertical axis, see text). Dashed vertical line corresponds to removal of 20% of holdings and the dashed horizontal line to 80% reduction of R0.

