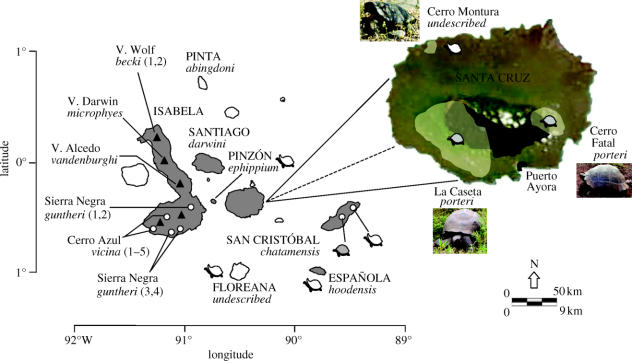
Figure 1.
Distribution maps of Galápagos tortoises throughout the archipelago and on Santa Cruz. Shaded islands indicate presence of extant tortoise populations and italized names represent current subspecific designations; island names indicated in all capitals, with distinct populations on Isabela specified by name; triangles represent volcanoes and circles indicate sampled populations throughout the archipelago. Shaded and unshaded tortoise caricatures signify ‘domed’ and ‘saddleback’ morphologies, respectively. The current distributions of tortoises (shaded yellow) and the agricultural corridor (shaded black) on Santa Cruz (Pritchard 1996) are plotted on a satellite map (MODOS Rapid Response Project, NASA/GSFC). Scale bar specified for the Galápagos archipelago (above) and Santa Cruz (below).

