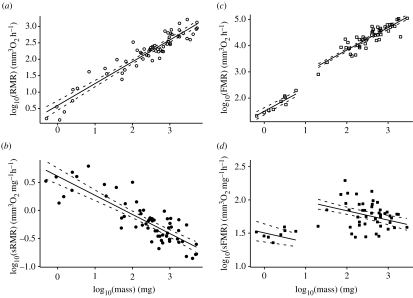
Figure 1.
Allometric scaling of resting (RMR) and flight metabolic rates (FMR) with insect body mass. Double-log plots of body mass versus (a) RMR, (b) mass-specific RMR (sRMR), (c) FMR and (d) mass-specific FMR (sFMR). Lines are least-squares regression lines (a), (b) and ANCOVA lines for small (less than 10 mg) and large (greater than 10 mg) insects (c), (d). Dashed lines indicate 95% confidence limits.

