
Figure 1.
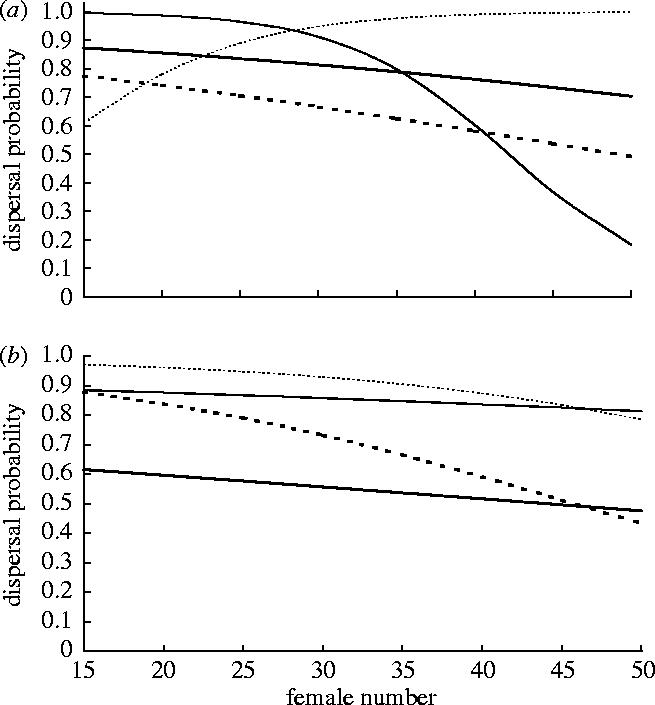
Relationships between female number and predicted dispersal probability in: (a) single-foundress and (b) two-foundress figs. Thick lines represent predictions when male number is low (=6), thin lines predictions when male number is high (=12). Solid lines represent predictions for small males (tibia length3=0.004 mm3), dotted lines predictions for large males (tibia length3=0.012 mm3).