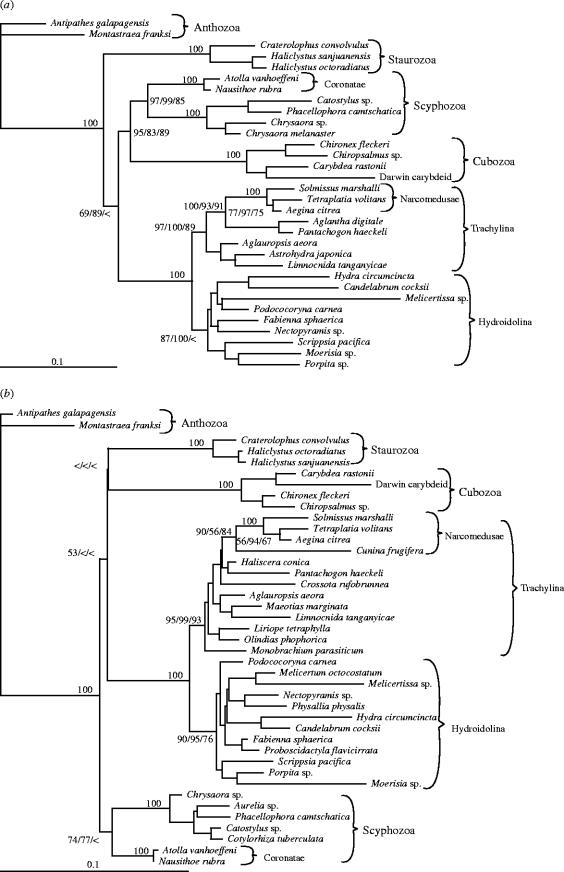
Figure 2.
ML topologies based on LSU (a) and SSU (b) data. Bootstrap values under ML, ME, and MP criteria are shown at nodes relevant to the present discussion. Nodes with bootstrap indices of 100 under all three criteria are indicated with a single 100. Bootstrap values less than 50 are represented by <. Assumed models of nucleotide evolution for ML and ME tree searches (GTR+I+G) have different rates for each type of substitution, an assumed proportion of invariant sites, and a gamma shape parameter. The length of the bars indicates 0.1 substitutions per site.

