
Figure 1.
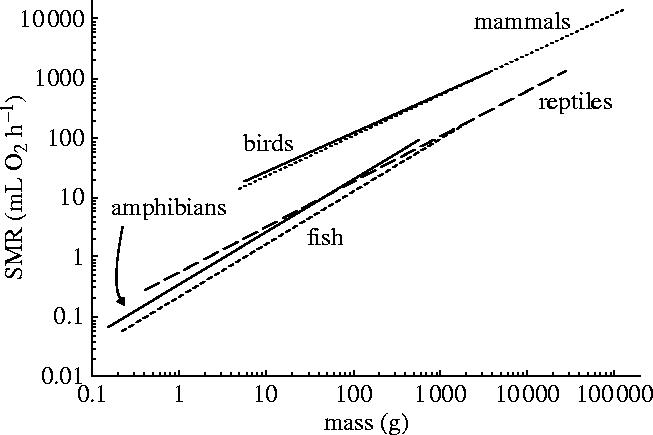
Scaling relationships between SMR normalized to a body temperature of 38 °C and body mass for mammals, birds, reptiles, amphibians and fish. Q10 values used for temperature normalization are presented in table 1, as are OLS (pictured) and RMA regression parameters.