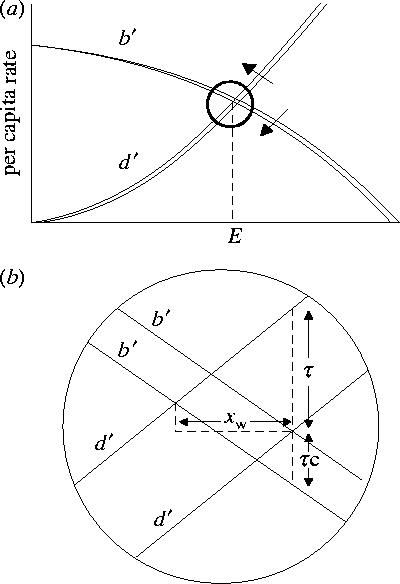
Figure 2.

(a) Carry-over effects from winter to summer influence population abundance via a shift in b′, further reducing E. As in figure 1, small changes can be considered linear. (b) Carry-over effects influence population size when there is a change in the mean quality habitat available, τ. In the model, the carry-over effect is expressed as a shift in b′, where its strength is determined by the carry-over effect constant, c, times τ (equation (2.3)).
