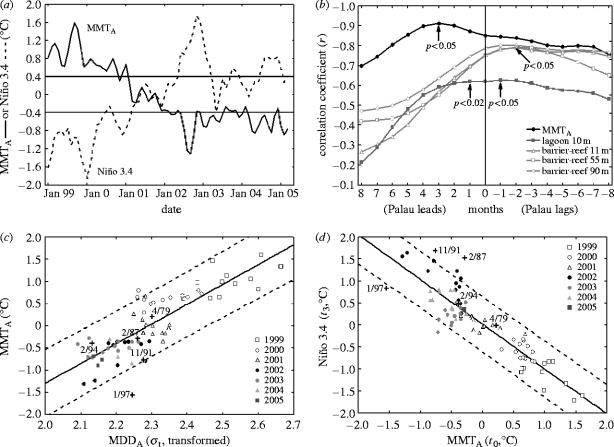
Figure 1.
(a) Mean mixolimnion temperature anomaly (MMTA) in Ongeim'l Tketau and unfiltered Niño 3.4 sea surface temperature anomaly between December 1998 and February 2005. El Niño or La Niña events defined as six consecutive months of anomalies >±0.4 °C (Trenberth 1997). (b) Strength of correlation between water temperature anomalies in Palau when defined as leading (positive) or lagging (negative) the Niño 3.4 by up to 8 months. (c) Relationship between MMTA and mixolimnion density difference anomaly (MDDA; transformed) at a lag of zero (r=0.85, p≤0.05). (d) Relationship between MMTA and Niño 3.4 when MMTA leads Niño 3.4 by 3 months (r=−0.91, p<0.05). In (c) and (d) the crosses (labelled with month and year (m/yr)) show unfiltered single-month measurements from one neutral (1979), three strong (1987, 1991 and 1997), and one weak (1994) El Niño years. Dashed lines define the 95% prediction interval.

