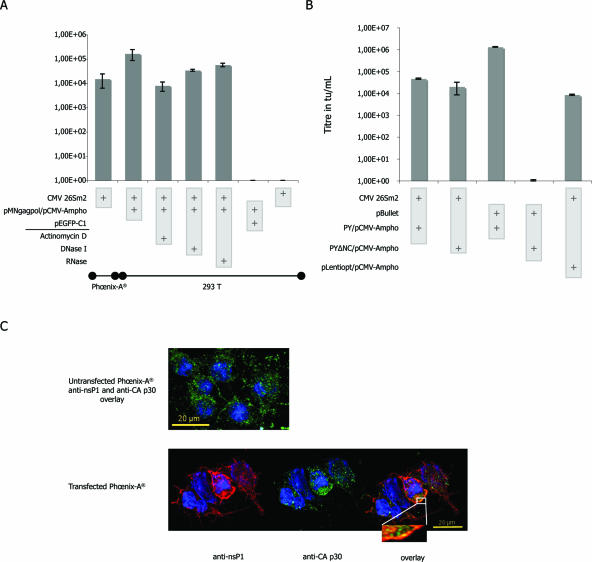
FIG. 3.
(A and B) Titers, means of results from five independent experiments, are expressed in transducing units per milliliter. Each column in the graphs is associated with a specific mix of plasmids identified by plus symbols in light gray boxes. For these experiments, we used the CMV-driven 26Sm2 SFV-derived vector. (A) Titers obtained using an RNA Pol II system for retroviral transcomplementation. Phœnix-A packaging cells were transfected using CMV 26Sm2. Tritransfection experiments were performed as described in the text. A series of controls was performed to eliminate passive transfer of plasmid or RNA: Pol II-driven transcription in transduced cells was inhibited through addition of actinomycin D; GFP detection titer at 104 tu/ml confirmed SFV-driven expression; supernatants were also treated with DNase I (125 IU) and RNase A (10 μg) before transduction with no effect on titers (columns 4 and 5, respectively); finally, the absence of titer obtained with pEGFP-C1 or 26Sm2 alone confirmed SFV retroviral mobilization. (B) Exploring the molecular requirement for SFV retroviral mobilization. The 26Sm2 replicon was mobilized using a retroviral transcomplementation system harboring a wild-type NC or a deleted NC (ΔNC). As opposed to what is observed using a classical GFP-expressing retroviral vector, pBullet (columns 3 and 4 of the graph), deletion of the NC had no effect on SFV mobilization (first two columns). In the last column, the lentiviral mobilization was tested with a Rev-independent Gag-PolHIV expression system (pLentiopt). The Gag-PolHIV titers were comparable to those obtained with the MLV system. Results are means from five independent experiments. (C) Cellular localization of MLV Gag and nsP1. Phœnix-A cells were transfected with the nsP1-expressing CMV 26Sm2 plasmid. Specific antibodies for MLV CA p30 and nsP1 were used to determine the cellular localization of the two proteins. Pictures are superpositions of six 0.25-μm-wide slices. (Upper panel) Overlay for control Phœnix-A cells not transfected but incubated with the two antibodies: only the green CA p30 signal is observed. (Lower panel) Pictures of transfected Phœnix-A cells: detection of nsP1 (in red), CA p30 (in green). The presence of several yellow dots on the overlay suggested the vicinity of the two proteins.

