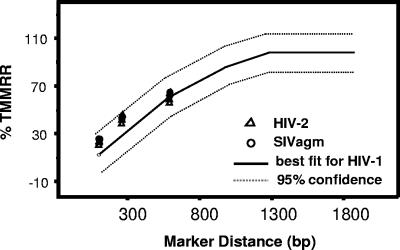
FIG. 5.
Comparison of HIV-2, SIVagm, and HIV-1 recombination rates. The previously described model of the relationship between HIV-1 recombination rate and marker distance is shown as a solid line, and its 95% confidence bands are shown as dashed lines. The 95% confidence band was computed by adding two estimated standard errors of estimate to predicted scores. The measured HIV-2 and SIVagm recombination rates at three marker distances (from Tables 1 and 2) are indicated by triangles and circles, respectively.

