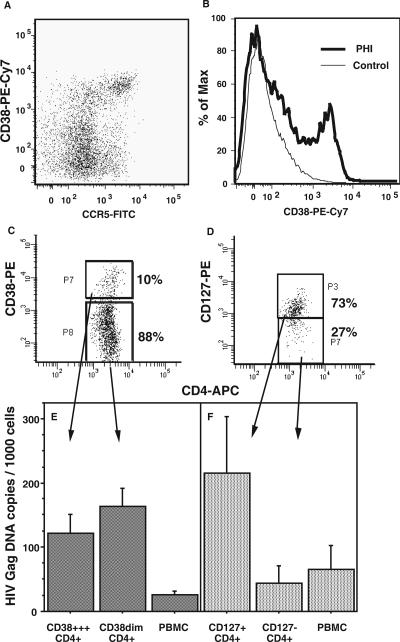
FIG. 1.
HIV DNA in CD38+++ and CD127+ subpopulations of CD4+ cells from PBMCs during PHI. A representative dot plot of CCR5+CD38+++ CD4+ T cells present in fresh whole blood during PHI is shown in panel A, and a representative comparison of CD38 expression on CD4+ T cells between a subject during PHI and a healthy adult control subject is shown in panel B. PBMCs were stained with CD4-APC and CD38-PE (C) or CD4-APC and CD127-PE (D) and sorted into different subpopulations. Representative histograms for each of the two sorting protocols are shown. DNA was extracted from purified cells, and the number of copies of HIV DNA per cell in each subpopulation was determined by quantitative PCR and normalized to beta-actin. Each column shows the mean (and standard error) from three independent experiments for each subpopulation of CD4+ cells defined by CD38 (E) or CD127 (F) as well as for the corresponding unsorted PBMC samples.

