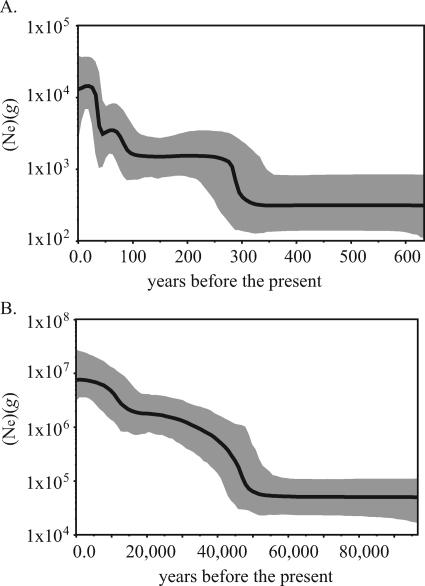
FIG. 3.
Skyline plots estimated from Bayesian MCMC analyses of (A) 158 JCV genomes found in geographically diverse populations and (B) 158 human mtDNA sequences with a similar geographical distribution. A priori nucleotide substitution rates of 1.7 × 10⁻⁵ and 1.7 × 10⁻⁸ subs/site/year were specified, respectively, while all other parameters were allowed to vary. The black line shows the median estimate of Θ (Ne × g) throughout the given time period. The gray area gives the 95% HPD interval of these estimates.

