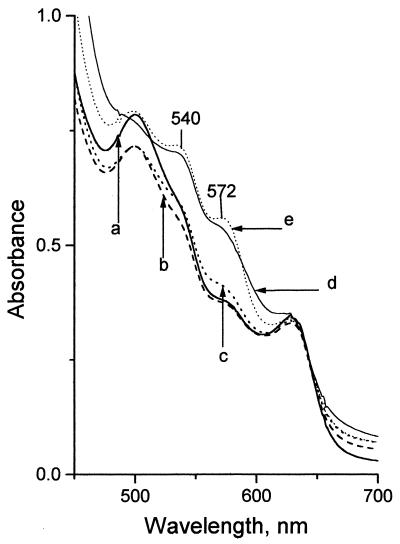
Figure 1.
Methemoglobin conversion to nitrosylhemoglobin. Shown are absorption spectra of solutions of 80 μM MetHb in 70 mM phosphate buffer (pH 7.0) at room temperature under N2. Trace a, MetHb solution at pH 7.0; trace b, MetHb solution at pH 7.2; trace c, MetHb solution with 100 mM KNO2; trace d, MetHb solution, equilibrated absorption spectrum measured ≈10 s after the addition of 160 μM ONOO−, final pH 7.2; trace e, absorption spectrum of MetHb solution 10 min after the addition of 160 μM Angeli's salt (pH 7.0).

