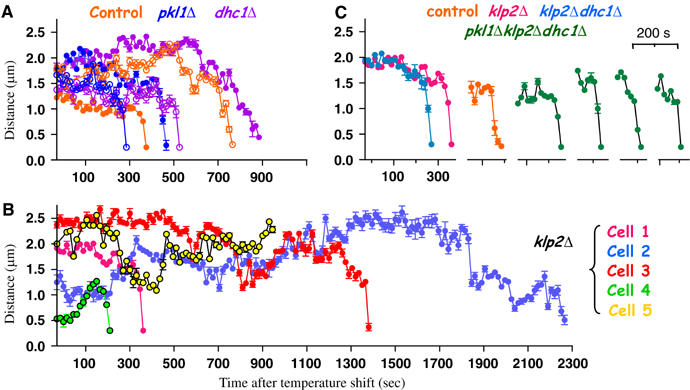
Figure 3.

Movements during chromosome retrieval in live cells. (A, B) Example traces of the kinetochore-to-pole distances versus time after the shift to 32°C (see also Supplementary Figure 6). (C) Comparison of the slopes of final kinetochore approaches for the klp2Δ cell 1 (Supplementary Video 5), klp2Δdhc1Δ cell (Supplementary Video 12), one control cell and 4 pkl1Δ klp2Δ dhc1Δ cells.
