
Figure 4.
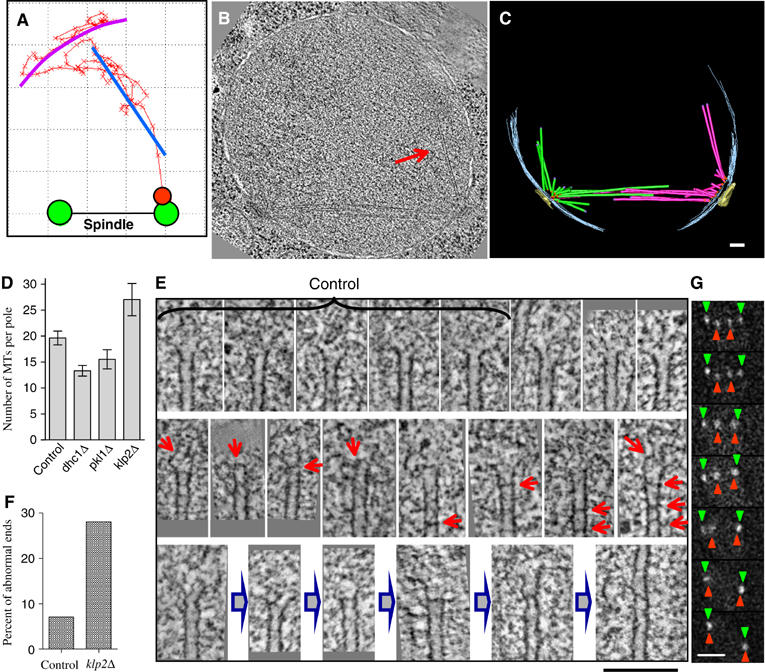
Klp2p facilitates kinetochore retrieval. (A) 2D trajectory of kinetochore retrieval in cell 3. The best fitting circular arc (magenta) for frames 1–50 (Supplementary Video 7); a best linear fit (blue) for frames 51–96. Tomographic slice (B) and 3D model (C) of nda3klp2Δ cell delayed in prometaphase (frozen 15 min after the shift to 32°C). Arrow in (B) points to one of the MTs in a two-MTs bundle growing from the right pole. Bar: 100 nm. (D) Average numbers of MTs per spindle pole for control nda3 cells (4 poles), nda3dhc1Δ (10), nda3pkl1Δ (6) and delayed nda3klp2Δ cells (6). (E) ET slices of the MTs plus ends. The first five images were collected from a control nda3 cell; all the rest are from six klp2Δ cells. There is a great variability in the appearance of the plus ends in both normal and mutant cells, which makes it difficult to quantify differences. Usually, the plus MT ends are splayed open (upper row), but in klp2Δ cells they frequently contain occlusions (red arrows). The images in middle row may represent intermediates that lead to ‘scarred' MTs with altered polymerization behavior; the bottom row suggests a possible pathway for the rescue of rapid shortening at an MT abnormality, followed by renewed MT polymerization. Bar: 100 nm. (F) Percent of MTs plus ends that show darker ‘bars' inside the MT lumen. Number of ends examined: control 68, klp2Δ 239. (G) Selected live images (30 s apart) from an nda3 klp2Δ dhc1Δ cell undergoing anaphase A. Bar: 2 μm.