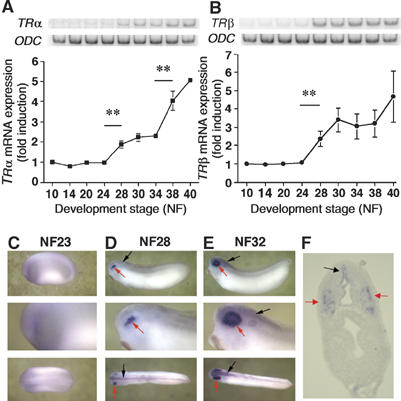
Figure 1.

TRα and TRβ gene transcripts are present during embryonic development. Total RNA from 20 embryos at stage NF10–40 were isolated and used for RT–PCR analyses of TRα (A) and TRβ RNA levels (B). ODC RNA level was used as an internal control. Blots were quantified and TR levels normalised against the ODC expression level. The average values±s.e.m. of three independent experiments are expressed as fold induction, where 1 is equal to normalised TR expression at stage NF10. TRβ expression was localised in stage NF23 (C), NF28 (D, F) and NF32 (E) by whole-mount ISH. Red arrows and black arrows indicate, respectively, expression in the eyes and neural tube. (F) Transverse section at stage NF28 showing TRβ expression profile within the head.
