
Figure 8.
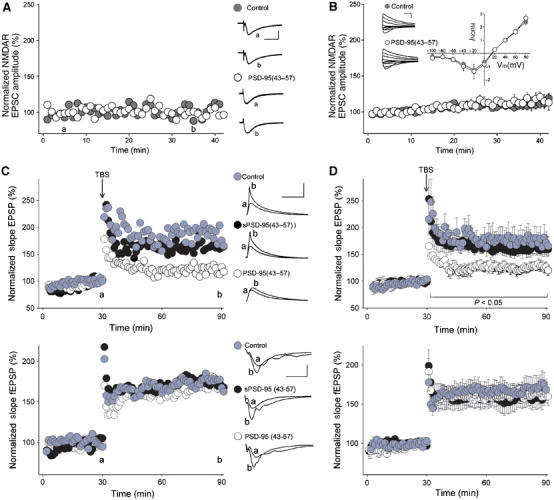
PSD-95(43–57) peptide depresses induction of LTP at Schaffer collateral–CA1 synapses. (A) Scatter plot of pharmacologically isolated NMDAR EPSCs from CA1 neurons in hippocampal slices. Peak amplitude is plotted over time for representative cells recorded with control ICS (•) or ICS supplemented with PSD-95(43–57) (○). Right: traces represent the average of six consecutive EPSCs at the times indicated (a and b). Scale bars are 100 ms/70 pA. (B) Average NMDAR EPSC amplitude (±s.e.m.) over time with control ICS (•; n=12) or PSD-95(43–57) (○; n=7). Inset: current–voltage (I–V) relationships for pharmacologically isolated NMDAR EPSCs with control ICS (•; n=11) or PSD-95(43–57) (○; n=10). Superimposed NMDAR EPSC traces at membrane potentials from −100 to +80 mV are shown for two representative cells. Scale bars are 200 ms/200 pA. (C) Scatter plots of EPSP slope (upper) and simultaneously recorded fEPSP slope (lower) from individual representative experiments with control ICS (•), the scrambled PSD-95(43–57) peptide (sPSD-95(43–57)) (•) or PSD-95(43–57) (○). Right: each trace represents the average of six consecutive EPSPs or fEPSPs recorded at the times indicated (a and b). Scale bars are 10 mV/100 ms for EPSPs and 0.8 mV/10 ms for fEPSPs. (D) Plot of average EPSP slope versus time for experiments with control ICS (•; n=11), sPSD-95(43–57) (•; n=12) or PSD-95(43–57) (○; n=10) (upper). Averaged slope of fEPSPs measured during experiments when whole-cell recordings were performed (lower).