Figure 7.

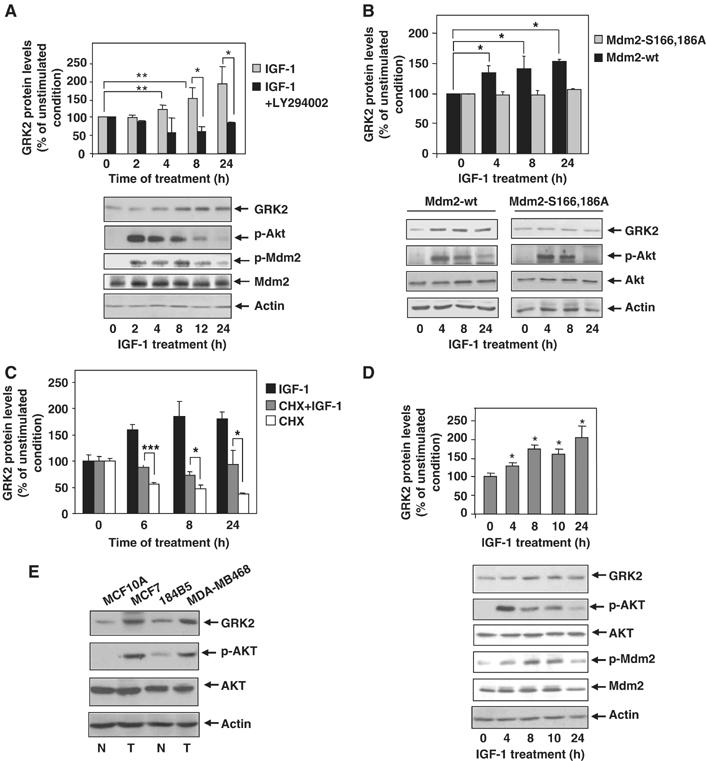
IGF-1 stimulation induces endogenous GRK2 protein accumulation in a PI3K-dependent manner. (A) MCF7 cells were serum-starved for 12 h and challenged with IGF-1 (50 ng/ml) for different times in the presence or absence of the PI3K inhibitor LY294002 (10 μM). Cells were subjected to immunoblot analysis with anti-GRK2, anti-Akt-pSer473, anti-Mdm2-pSer166 and anti-Mdm2 antibodies. GRK2 band densities were normalized by actin protein levels and expressed as percentage of GRK2 level in unstimulated conditions. Data are mean±s.e.m. of five independent experiments performed in duplicate. *P<0.05, **P<0.01. (B) IFG-1-dependent upregulation of GRK2 is prevented by expression of an Mdm2 mutant defective in Akt-mediated phosphorylation. MCF7 cells transiently overexpressing either wild-type Mdm2 or the ligase mutant Mdm2 S166, 186A were serum-starved as above and stimulated with IGF-1 (50 ng/ml) for the indicated times. Expression levels of GRK2, Akt-pSer473, Akt and actin were determined by immunoblotting. Data were analyzed and depicted as in panel A. Representative blots are shown. (C) IGF-1 increases GRK2 protein by decreasing its degradation rate without altering its protein synthesis. Endogenous GRK2 protein levels were determined by immunoblot analysis in MCF7 cells stimulated with IGF-1 as above in the presence or absence of cycloheximide and compared with cycloheximide treatment alone. Data are mean±s.e.m. of three independent experiments. *P<0.05; ***P<0.001. (D) GRK2 protein accumulation is induced by IGF-1 challenge, in the non-transformed mammary cell line MCF10A. Cells were treated as above and levels of GRK2, Akt-pSer473, Akt, Mdm2-pSer166, Mdm2 and actin immunodetected with specific antibodies. The patterns of Akt activation, Mdm2 phosphorylation and GRK2 protein increase are similar to those observed in MCF7 cells. (E) Transformed mammary cells display higher levels of Akt activity and GRK2 protein. Both malignant transformed (T, MDA-MB486 and MCF7) and non-transformed cells (N, MCF10A and 184B5) were lysed in RIPA buffer and expression levels of GRK2, Akt-pSer473, Akt and actin were determined as above. Representative blots from three independent experiments are displayed.
