
Figure 9.
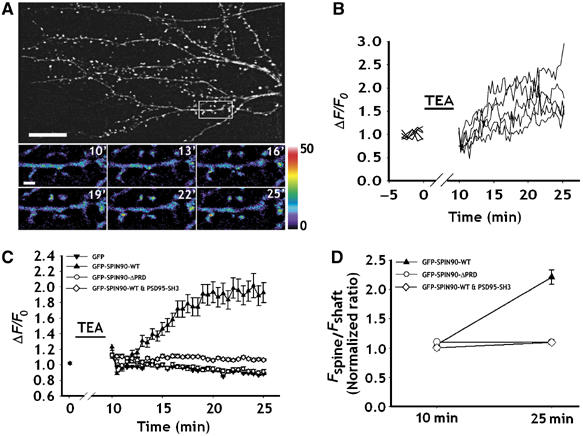
SPIN90/WISH is redistributed into dendritic spines by chemically induced LTP. Neurons were transfected with various GFP-tagged SPIN90/WISH constructs and chemical LTP was induced. Time-lapse images were acquired every 30 s for 15 min after TEA treatment. (A) Representative fluorescence images of neurons that underwent chemical LTP. High-magnification views are of the dendritic spine regions enclosed in rectangles. The color scale gives fluorescence intensities in arbitrary fluorescence units. Scale bar, 1 μm. (B) The curves represent the changes in fluorescence intensity of each dendritic spine in (A). TEA indicates the time of application of medium inducing chemical LTP. (C) Quantitative analysis of the normalized fluorescence intensities of the GFP signal in the dendritic spines. F0 indicates average fluorescence intensity before TEA treatment. Net fluorescence changes (ΔF) and ΔF/F0 values were obtained as described in Materials and methods. (D) The ratios of fluorescence intensities of dendritic spines over shafts (Fspine/Fshaft). Black triangles: ratios in GFP-SPIN90/WISH-transfected neurons; white diamonds: ratios in GFP-SPIN90/WISH-ΔPRD-transfected neurons. Ten minutes refers to immediately after TEA treatment and 25 min indicates the end of time-lapse recording. Data are means±s.e.