
Figure 2.
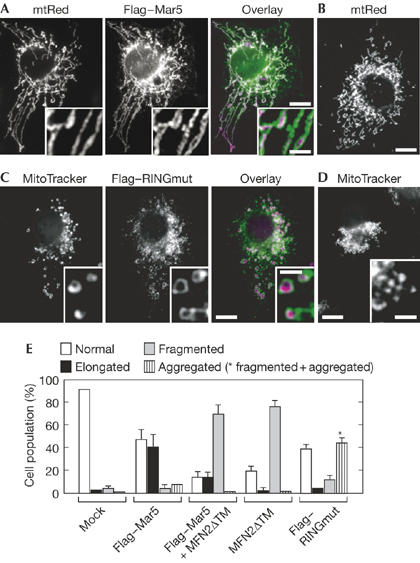
Effects of MARCH-V overexpression on mitochondrial morphology. (A,B) COS7 cells stably expressing matrix-targeted red fluorescent protein (mtRed) were transiently transfected with Flag–Mar5 and stained with Flag antibody. Signals for Flag and mtRed are shown in green and magenta, respectively. Insets show higher magnification images. A typical example of normal mitochondrial morphology in non-transfected cells is shown in (B). Scale bars, 10 (A,B) and 2 μm (A, inset). (C,D) COS7 cells transiently transfected with Flag–RINGmut were stained with Flag antibody and MitoTracker. Signals for Flag and MitoTracker are shown in green and magenta, respectively. Insets show higher magnification images. Expression of Flag–RINGmut caused aggregation of fragmented mitochondria in the perinuclear region, as shown in (D). Scale bars, 10 and 2 μm (insets). (E) Percentage of cell population with normal (open bar), elongated (solid bar), fragmented (grey bar) and aggregated (striped bar) mitochondria in COS7 cells transiently transfected with mock (n=527), Flag–Mar5 (n=306), Flag–Mar5 plus MFN2ΔTM (n=302), MFN2ΔTM (n=303) or Flag–RINGmut (n=306). The asterisk represents the cell population of aggregated and fragmented mitochondria. Data represent the mean±s.d. of three independent experiments.