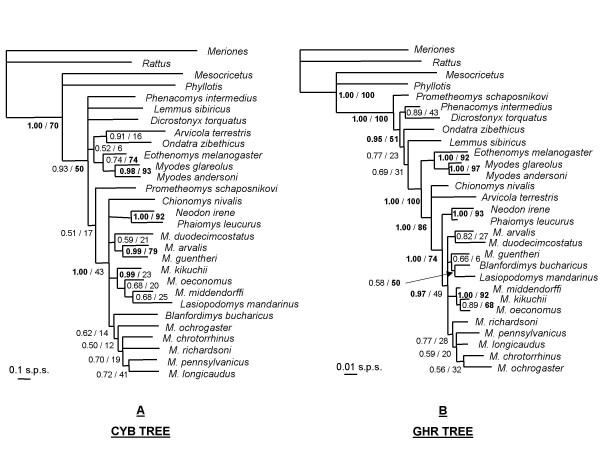
Figure 1.
Maximum posterior probability trees reconstructed from the mitochondrial CYB (left, A) and nuclear GHR (right, B) sequences. Two reliability indices are given on nodes: the Bayesian posterior probabilities/the maximum likelihood bootstrap percentages. Note the difference of scale (expressed as substitutions per sites [s.p.s.]).

