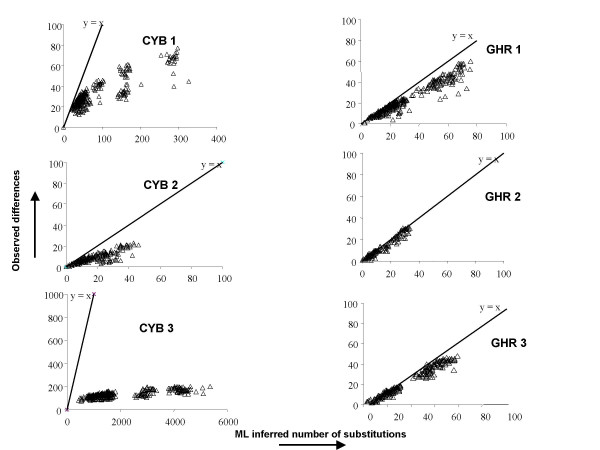
Figure 3.
Saturation plots of the number of observed differences as a function of the numbers of inferred substitutions for each pair of sequences at each codon position of CYB and GHR genes. The Y = X straight line corresponds to the situation where there is no homoplasy detected in the data. Note that the scale of the X-axis is four-fold the scale of the other partitions for CYB1, and 60-fold for CYB3. The scale of the Y-axis is 10-fold the scale of the other partitions for CYB3.

