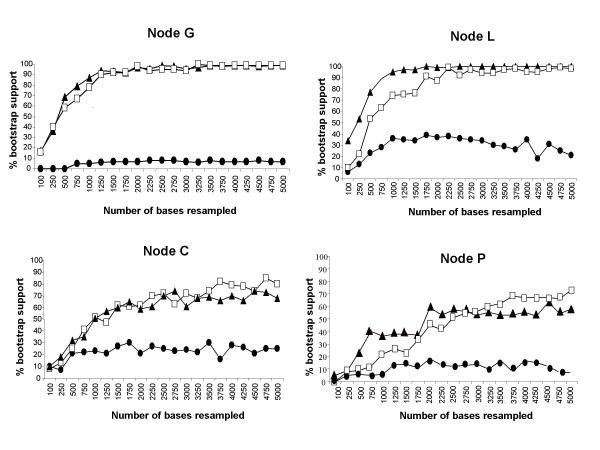
Figure 4.
Plots of the variable-length bootstrap percentages for CYB (filled circles), GHR (filled triangles), and combined data (open squares) for four nodes recovered in Bayesian and ML analyses (see Fig. 2). The X-axis is the number of sites resampled (in 250-bp increments from 0 to 5000-bp), and the Y-axis is the maximum likelihhod BP percentage (out of 100 pseudoreplicates).

